This data is untidy for given reasons:
- Each row contains more than one observation.
- Most fields contain more than one value.
The same data can be represented in multiple ways. There is even room for variance in the class of rectangular representations of data. Some manners of representations are more useful for certain purposes than for others. For data analysis (plotting, statistical analyses) we prefer to represent our data as (rectangular) tidy data. A concise rationale for using tidy data is given in Figure 4.1.
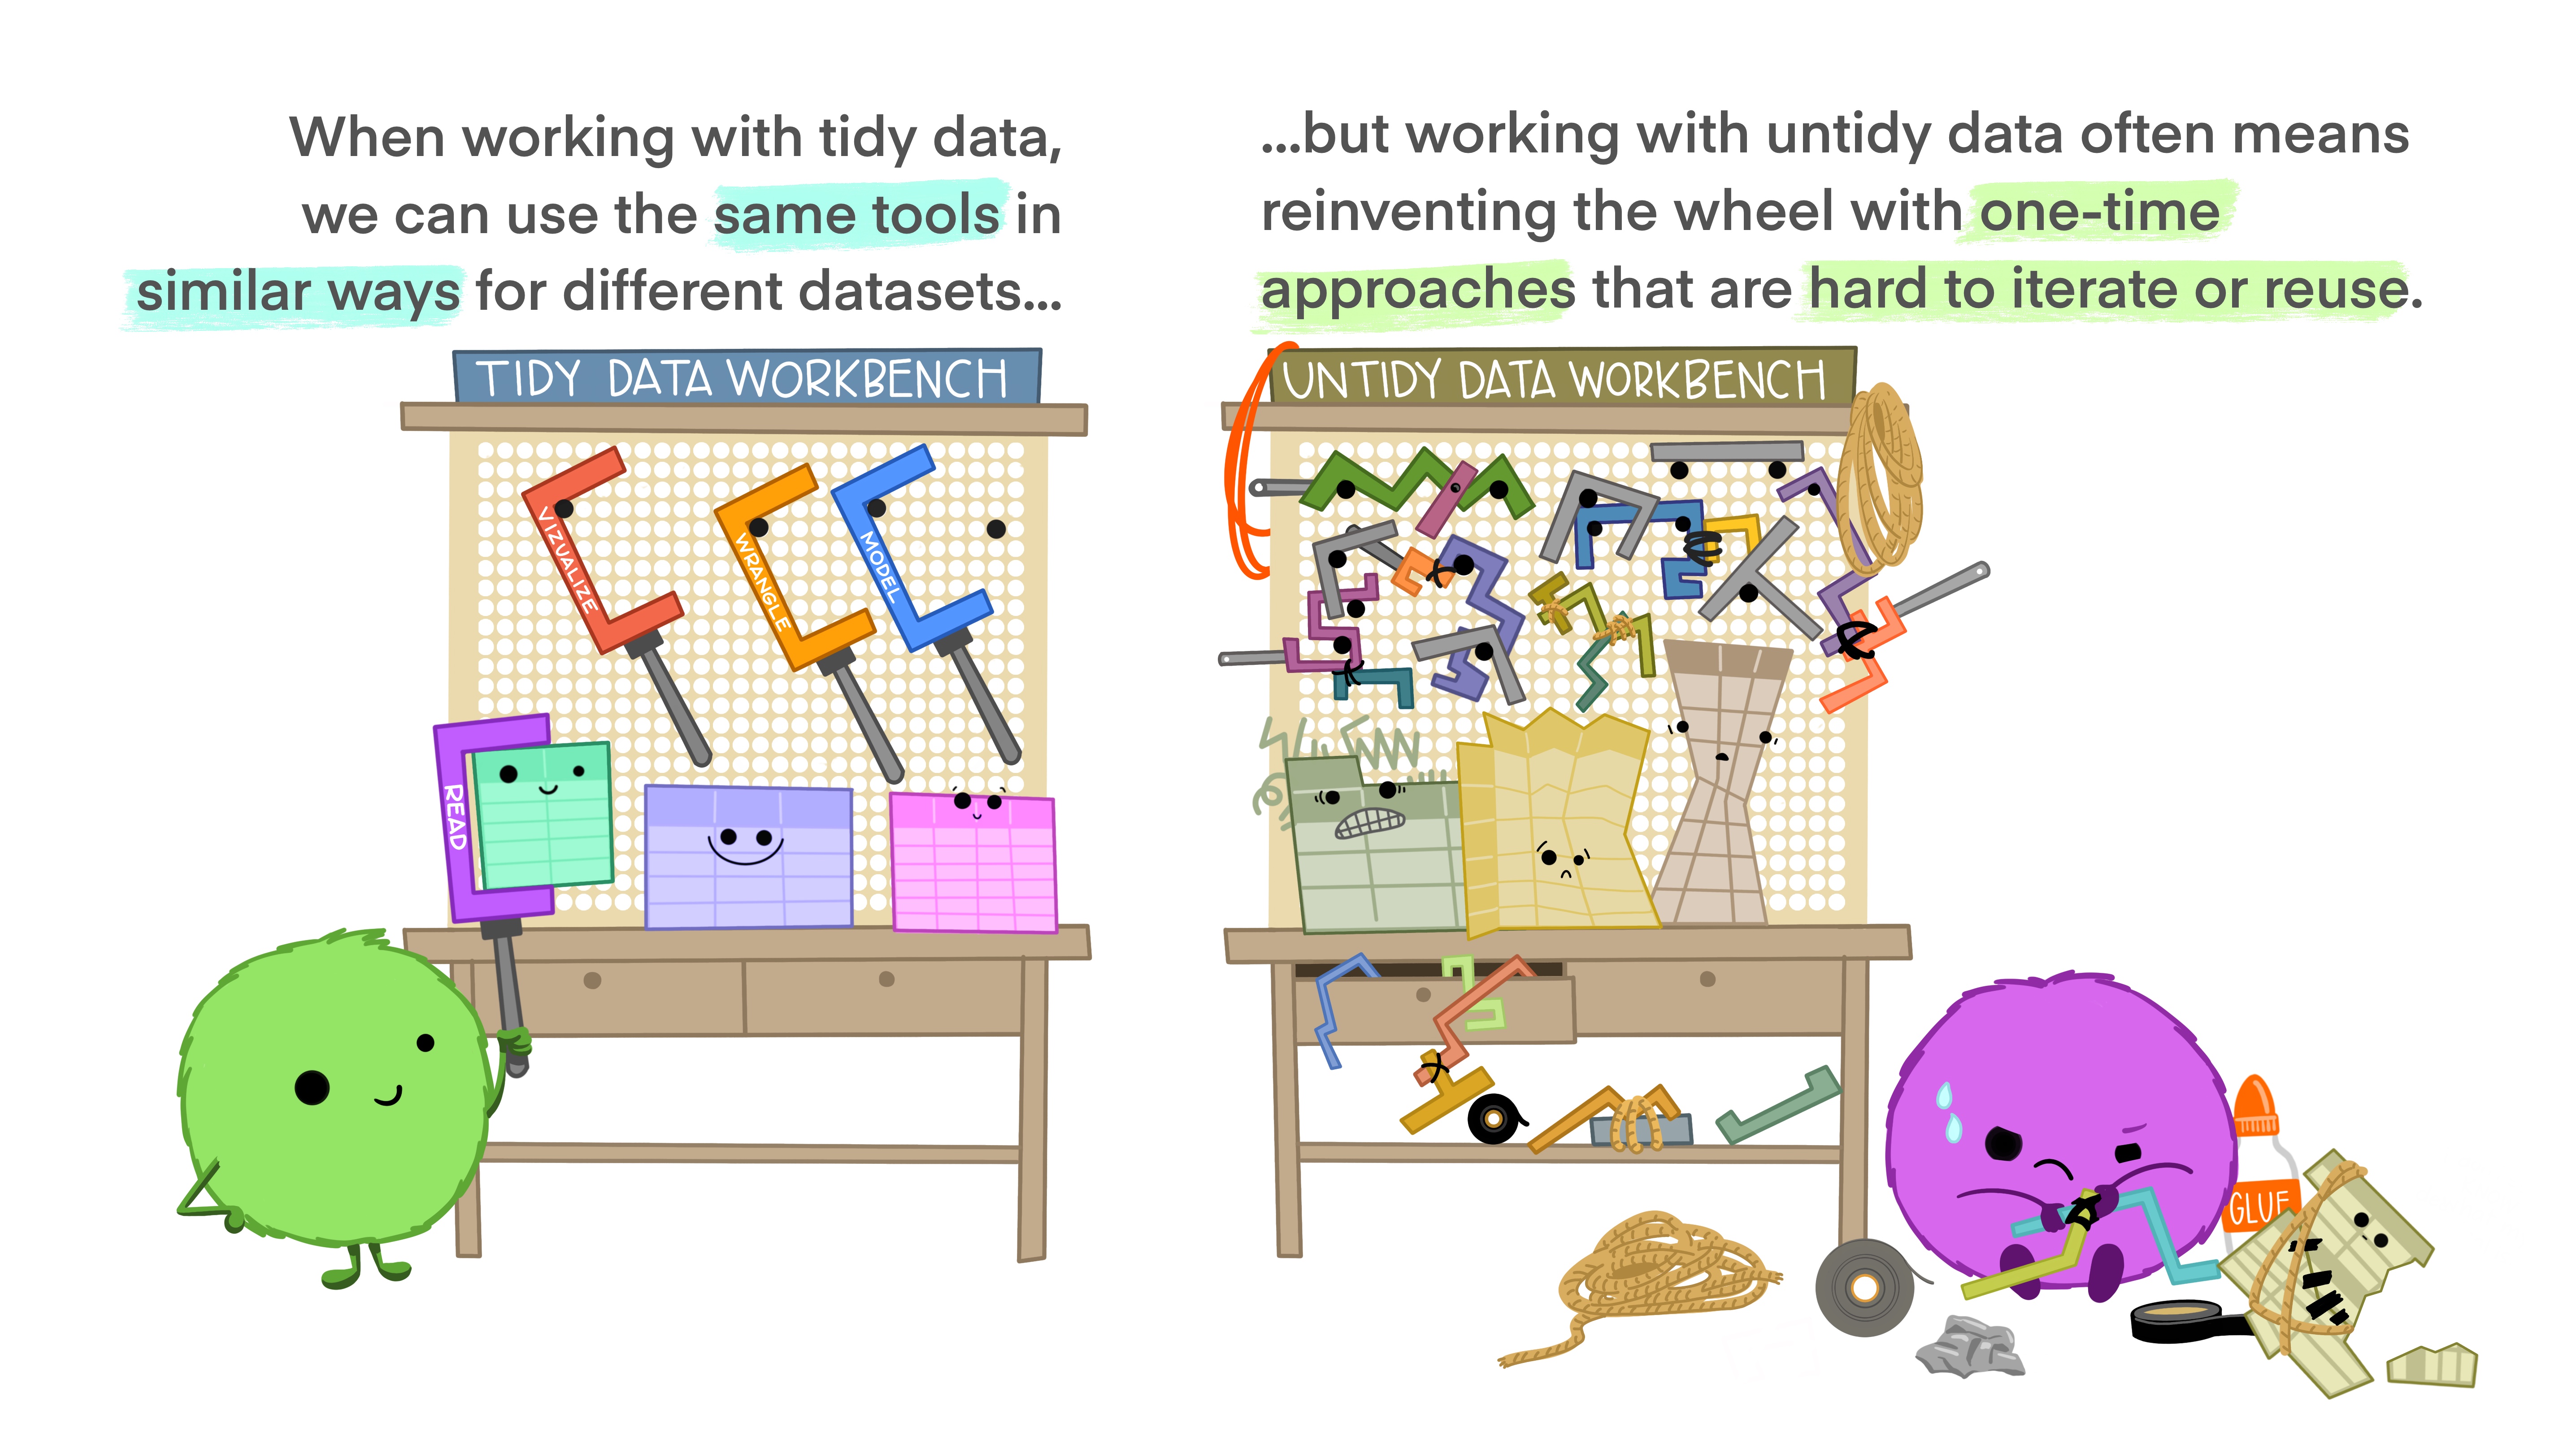
Figure 4.1: Artwork by allison_horst
Consider the example of student grades for two exams in a course. A compact way of representing the data for visual digestion is the following representation:
exam_results_visual <- tribble(
  ~exam,       ~"Rozz",   ~"Andrew",   ~"Siouxsie",
  "midterm",   "1.3",     "2.0",       "1.7",
  "final"  ,   "2.3",     "1.7",       "1.0"
)
exam_results_visual
## # A tibble: 2 × 4
## exam Rozz Andrew Siouxsie
## <chr> <chr> <chr> <chr>
## 1 midterm 1.3 2.0 1.7
## 2 final 2.3 1.7 1.0This is how such data would frequently be represented, e.g., in tables in a journal. Indeed, Rmarkdown helps us present this data in an appetizing manner, e.g., in Table 4.1, which is produced by the code below:
knitr::kable(
  exam_results_visual,
  caption = "Fictitious exam results of fictitious students.",
  booktabs = TRUE
)| exam | Rozz | Andrew | Siouxsie |
|---|---|---|---|
| midterm | 1.3 | 2.0 | 1.7 |
| final | 2.3 | 1.7 | 1.0 |
Though highly perspicuous, this representation of the data is not tidy, in the special technical sense we endorse here. A tidy representation of the course results could be this:
exam_results_tidy <- tribble(
  ~student,    ~exam,      ~grade,
  "Rozz",      "midterm",  1.3,
  "Andrew",    "midterm",  2.0,
  "Siouxsie",  "midterm",  1.7,
  "Rozz",      "final",    2.3,
  "Andrew",    "final",    1.7,
  "Siouxsie",  "final",    1.0
)
exam_results_tidy
## # A tibble: 6 × 3
## student exam grade
## <chr> <chr> <dbl>
## 1 Rozz midterm 1.3
## 2 Andrew midterm 2
## 3 Siouxsie midterm 1.7
## 4 Rozz final 2.3
## 5 Andrew final 1.7
## 6 Siouxsie final 1Following Wickham (2014), a tidy representation of (rectangular) data is defined as one where:
Any data set that is not tidy is messy data. Messy data that satisfies the first two constraints, but not the third will be called almost tidy data in this course. We will work, wherever possible, with data that is at least almost tidy. Figure 4.2 shows a graphical representation of the concept of tidy data.
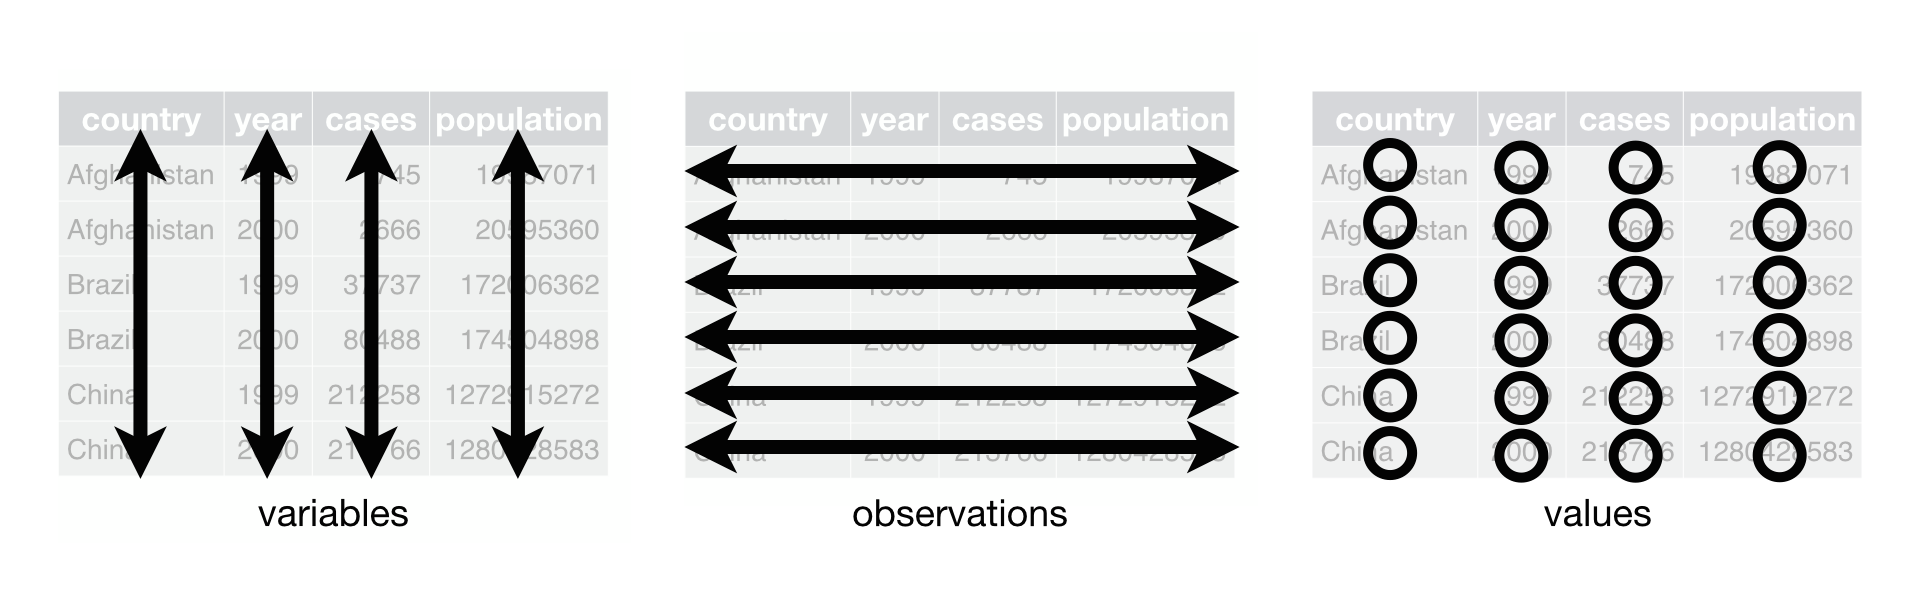
Figure 4.2: Organization of tidy data (taken from Wickham and Grolemund (2016)).
The final condition in the definition of tidy data is not particularly important for us here (since we will make do with ‘almost tidy data’), but to understand it nonetheless consider the following data set:
exam_results_overloaded <- tribble(
  ~student,    ~stu_number,    ~exam,      ~grade,
  "Rozz",      "666",          "midterm",  1.3,
  "Andrew",    "1969",         "midterm",  2.0,
  "Siouxsie",  "3.14",         "midterm",  1.7,
  "Rozz",      "666",          "final",    2.3,
  "Andrew",    "1969",         "final",    1.7,
  "Siouxsie",  "3.14",         "final",    1.0
)
exam_results_overloaded
## # A tibble: 6 × 4
## student stu_number exam grade
## <chr> <chr> <chr> <dbl>
## 1 Rozz 666 midterm 1.3
## 2 Andrew 1969 midterm 2
## 3 Siouxsie 3.14 midterm 1.7
## 4 Rozz 666 final 2.3
## 5 Andrew 1969 final 1.7
## 6 Siouxsie 3.14 final 1This table is not tidy in an intuitive sense because it includes redundancy. Why list the student numbers twice, once with each observation of exam score? The table is not tidy in the technical sense that not every observational unit forms a table, i.e., the observation of student numbers and the observation of exam scores should be stored independently in different tables, like so:
# same as before
exam_results_tidy <- tribble(
  ~student,    ~exam,      ~grade,
  "Rozz",      "midterm",  1.3,
  "Andrew",    "midterm",  2.0,
  "Siouxsie",  "midterm",  1.7,
  "Rozz",      "final",    2.3,
  "Andrew",    "final",    1.7,
  "Siouxsie",  "final",    1.0
)
# additional table with student numbers
student_numbers <- tribble(
  ~student,    ~student_number,
  "Rozz",      "666",
  "Andrew",    "1969",
  "Siouxsie",  "3.14"
)
Notice that, although the information is distributed over two tibbles, it is linked by the common column student. If we really need to bring all of the information together, the tidyverse has a quick and elegant solution:
full_join(exam_results_tidy, student_numbers, by = "student")## # A tibble: 6 × 4
## student exam grade student_number
## <chr> <chr> <dbl> <chr>
## 1 Rozz midterm 1.3 666
## 2 Andrew midterm 2 1969
## 3 Siouxsie midterm 1.7 3.14
## 4 Rozz final 2.3 666
## 5 Andrew final 1.7 1969
## 6 Siouxsie final 1 3.14Exercise 4.1: Tidy or Untidy?
Lets take a look at this made up data set:
data <- tribble(
~subject_id,  ~choices,  ~reaction_times,
1,            "A,B,B",   "312 433 365",
2,            "B,A,B",   "393 491 327",
3,            "B,A,A",   "356 313 475",
4,            "A,B,B",   "292 352 378")
Is this data tidy or untidy? Explain your reasoning.
This data is untidy for given reasons: